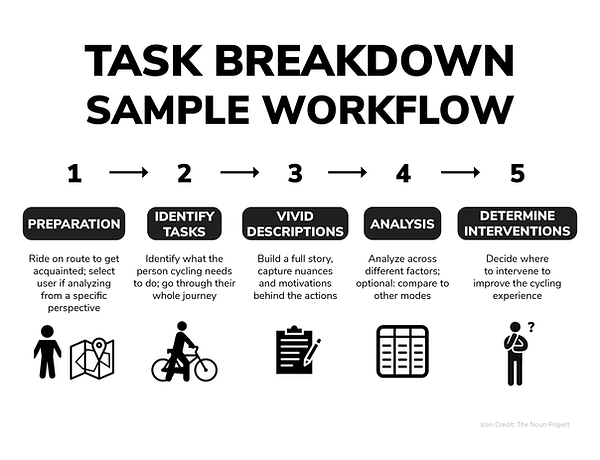
TASK BREAKDOWN
WHAT: Documentation and visualization of all tasks that need to be completed to get from Point A to Point B on a bicycle.
WHY: Understand the micro-level tasks that people cycling have to perform while riding and see where design can intervene to improve the experience.
END GOAL: Less taxing steps are required to get from Point A to Point B on a bicycle; design considers the details of what people cycling encounter on the street.

Above: An example of visually representing a task breakdown

The traditional design method is a "task analysis". The task hierarchy diagram (example above from Dimitra Dimitrakopoulou, 2017), is one way to visually organize the actions that someone takes. The map further above takes select actions and shows where they occur.
The exact format of the visual is not what is important- just think about if it keeps people's experience on the street at the center of attention. After identifying the tasks on route and considering the physical, perceptual, and cognitive activities involved, you do the analysis to decide where to improve the cycling experience. You can do this with a table like the one below (click for .xls).


